Pandas - Creating DataFrames
Data Science.
Data.
It's right there in the name.
Using the Python programming language and it's many libraries, Data Scientists can complete a veriety of different tasks. One of the main tasks of a Data Scientist is to work with 'data' and figure out how to use it to their advantage to solve a variety of different problems that arise every single day.
One of the most important libraries of the Python programming language is 'Pandas' and we will be exploring some of the capabilities of this library and how it can be used to:
1) Create DataFrames/Upload data
2) Filter and extract data
3) Exploring and Analyzing data
In this blog we will focus on how to load datasets and create our very own DataFrames and how to quickly view and understand the data within the DataFrames.
If you're someone like me who needs to see things in action to get a better understanding of how they work then do not worry we are about to get started now!

The first thing we need to do is to import the Pandas library into our notebook to get started:
import pandas as pd
(it is standard industry practice to import and store pandas into 'pd')
It is good practice to import whichever libraries you will be using in your work at the very beginning of your notebook to keep everything organized and clean
The beauty of using Pandas is that it allows you to analyze and explore data in many different ways and many different sizes.
You can load prebuilt datasets using:
data_name = pd.read_csv('file_name.csv')
(This function allows you to upload csv files which are excel based into your notebook. This is extremely helpful when you need to analyze large data sets which are already created.)
Or
Lets say you want to analyze a small data sample. You can easily whip up your own data set using Pandas pd.DataFrame function.
Lets go ahead and give you an example:
I am going to quickly whip up a dataframe of the Toronto Raptors 2019 championship roster and assign columns to hold information
raptors = pd.DataFrame({
            'name':['Kawhi Leonard','Kyle Lowry', 'Pascal Siakam', 'Danny Green', 'Marc Gasol',
            'Fred VanVleet', 'Serge Ibaka', 'NormanPowell', 'Jeremy Lin', 'Patrick McCaw',
            'Jodie Meeks', 'OG Anunoby', 'Chris Boucher'],
            'age': [27,33,25,31,34,25,29,26,30,23,31,21,26],
            'nationality': ['USA', 'USA', 'Cameroon', 'USA', 'Spain', 'USA','Spain','USA', 'USA',
                'USA','USA','England', 'Saint Lucia'],
            'position': ['Forward', 'Guard', 'Forward', 'Guard', 'Centre','Guard', 'Forward',
             'Guard', 'Guard', 'Guard','Guard', 'Forward','Forward']
})

raptors

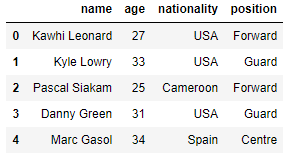
Here I have created my very own DataFrame by inputting information into a dictionary and using the pd.DataFrame function to return me an organized table using the columns that I specified to help me now better explore and analyze the data.
From my own personal experience, I know that python code can be a little intimidating at first glance and can make things seems a little confusing so lets break down my process here step by step:
-
Call upon the pd.DataFrame() function to specify what the code will be doing (we will be building our data within the ())
-
Using {} specifies that we will be creating a dictionary
Now to populate the dictionary with the information:
-
'name', 'age', 'nationality', and 'position' are the names of the columns I want to created for my data (if you look closely you wil notice that the column names are inside the {} but are on the outside of the [] )
-
Now we will use [] to populate a list of information inside each column name we want created (eg. for the name column we will populate a list[] of Raptor player names, for the age column a list[] of ages, and so on...)
-
Once we are finished populating the information we desire we simply wrap the code up and voila...
WE GOT OURSELVES A DATASET!
The return output will be the information we inputted in the form of a table displayed above
Since we have created this dataset exactly how we wanted we know that the information in here is legit. But, that is not always the case especially when you need to explore big datasets. Information can be corrupted, missing, all kinds of stuff and it is up to us to figure it out.
Now we are going to explore some functions that will help us view our data more closely and help us better understand it. DataFrames are extremely powerful and useful objects: 'containers' that hold a lot of information. There are many functions built within Pandas that will allow us explore and manipulate this data to our liking but today we are going to just focus on just some of the basics.
We are going to be taking a look at:
.head()
.info()
.describe
Lets bring back our DataFrame and get started.
raptors
Take a look at the above DataFrame. When we call the name 'raptors' it displays the entire thing. This is fine here because our dataset is not large by anymeans. But what if we had a file or DataFrame consisting of hundreds, thousands or even millions of rows? It would take awhile for our computers to be able to extract them all and display it back to us. This is where the .head() function comes in handy.
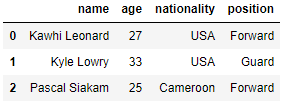
Using .head() on a dataframe automatically extracts the first 5 rows along with the column names to output back to us like so:
raptors.head()
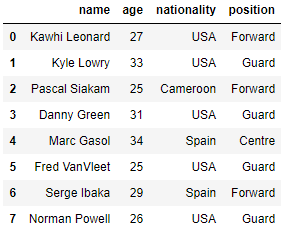
If we wanted more or less rows displayed back to us all we need to do is specify the number within the ()
raptors.head(3)
raptors.head(8)
Now that we have a good grasp on how the .head() function work lets move on.
.info()
This is one of Pandas most important functions and should always be used when working with new DataFrames.
.info() displays a lot of information that tells us:
-
Name of columns
-
Range Index (number of rows in the DataFrame)
-
Count of non-null values (null values are blank values or empty white spaces)
-
The type of data contained in the columns (string, object, integer or float)
-
Count of the data types (how many string columns, objects, etc.)
Now lets try on our raptors DataFrame:
raptors.info()
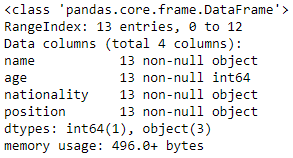
We now have all the info we need about our raptors DataFrame to continue working on our data. Because we created this DataFrame ourselves we know that their is no missing or corrupted data and that all columns contain the correct information so therefore we dont need to do any dat cleaning. But in most cases when you run .info() on a DataFrame it is to see what changes need to be made and what needs to be cleaned up so that we have a proper DataFrame to use to do our analyzing.
Another good function to use on our data will be .describe
This function describes the info in the DataFrame as statistics
raptors.describe()
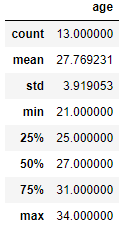
Because we only have one numerical column (age) .describe is only able to show information on this
Here you can see the statistics of the age columns.
Well there you go! We just learned how to load data into our Python notebooks and how to create our very own DataFrames from scratch and how to quickly view the data within.

Believe me I know that all of this can be very overwhelming when trying to learn a programming language for the first time but I hope I was able to keep things simple and easy and following along has not been difficult.
Like I mentioned before there are many functions that can be used with Pandas to explore data but I believe that these 3 that I presented above are the most important ones to learn and understand first before you dive in deeper to more complex ones.